selecta
privateA taste graph built from a music library that already knows me.
The problem
Every streaming service has an opinion about our taste, and none of them will show us the math. Those stats belong to the platform, not to us, and we get to look at them once a year when they are packaged up and handed back as a wrapped.
I have been collecting and building my music library since I was a teenager. It started in iTunes and grew over time into a larger ecosystem, which I will get into below: the library itself, years of play history, a log of every show I have been to. It just sat in four different places with nothing reading it.
selecta is me taking advantage of it. My library, my history, my scoring, running on my own hardware, with the reasoning visible.
The library
All the music I have been listening to since I was a teenager sits in one library, tagged, filed, and grouped into collections by hand. It started in iTunes (still the source of truth for organizing).
Syncthing continuously syncs that library to my server, which runs Plex, and plex-itunes-sync carries the structure across on top of it, so playlists become Plex collections and label groupings become album metadata. Then I actually listen on Plex, through Plexamp, on every device I own, wired into the rest of my J.A.R.V.I.S. home ecosystem.
Tautulli sits on the Plex server and records every play. That is the listening history: what I played, when, and how often, going back years.
The whole arrangement is about ownership. I own the files, the server they sit on, the app I listen in, and the stats. None of it is a row in someone else's dashboard. selecta is what became possible once all of that was mine, in one place, with years of listening history behind it.
What it is
A read-only intelligence layer over sources that were already automated. It pulls from four places and never writes back to any of them:
- —Plex — artists, albums, genres, record labels, and the curated collections I organize albums into
- —Tautulli — all-time and recent play counts per artist, plus a month-by-month timeline
- —The collection and label taxonomy my library automation already publishes
- —An attended-shows log I keep in my wiki, resolved to venues and coordinates
Affinity
Everything collapses into one number per artist. Six signals, each weighted: albums in a personally curated collection, albums in any followed collection, albums on a label I follow, albums simply owned, play count, and shows attended. Plays and shows are scaled logarithmically so a single obsession doesn't flatten everything else, and every component is capped for the same reason.
The important part is that the breakdown is stored alongside the score, not thrown away. Any artist in the graph can tell me exactly why they rank where they rank, and the weights live in a config file I can argue with.
The graph
The full library at depth 1,000. Every cluster is a scene, every square is a label, and the dense knots are the genres I never left.
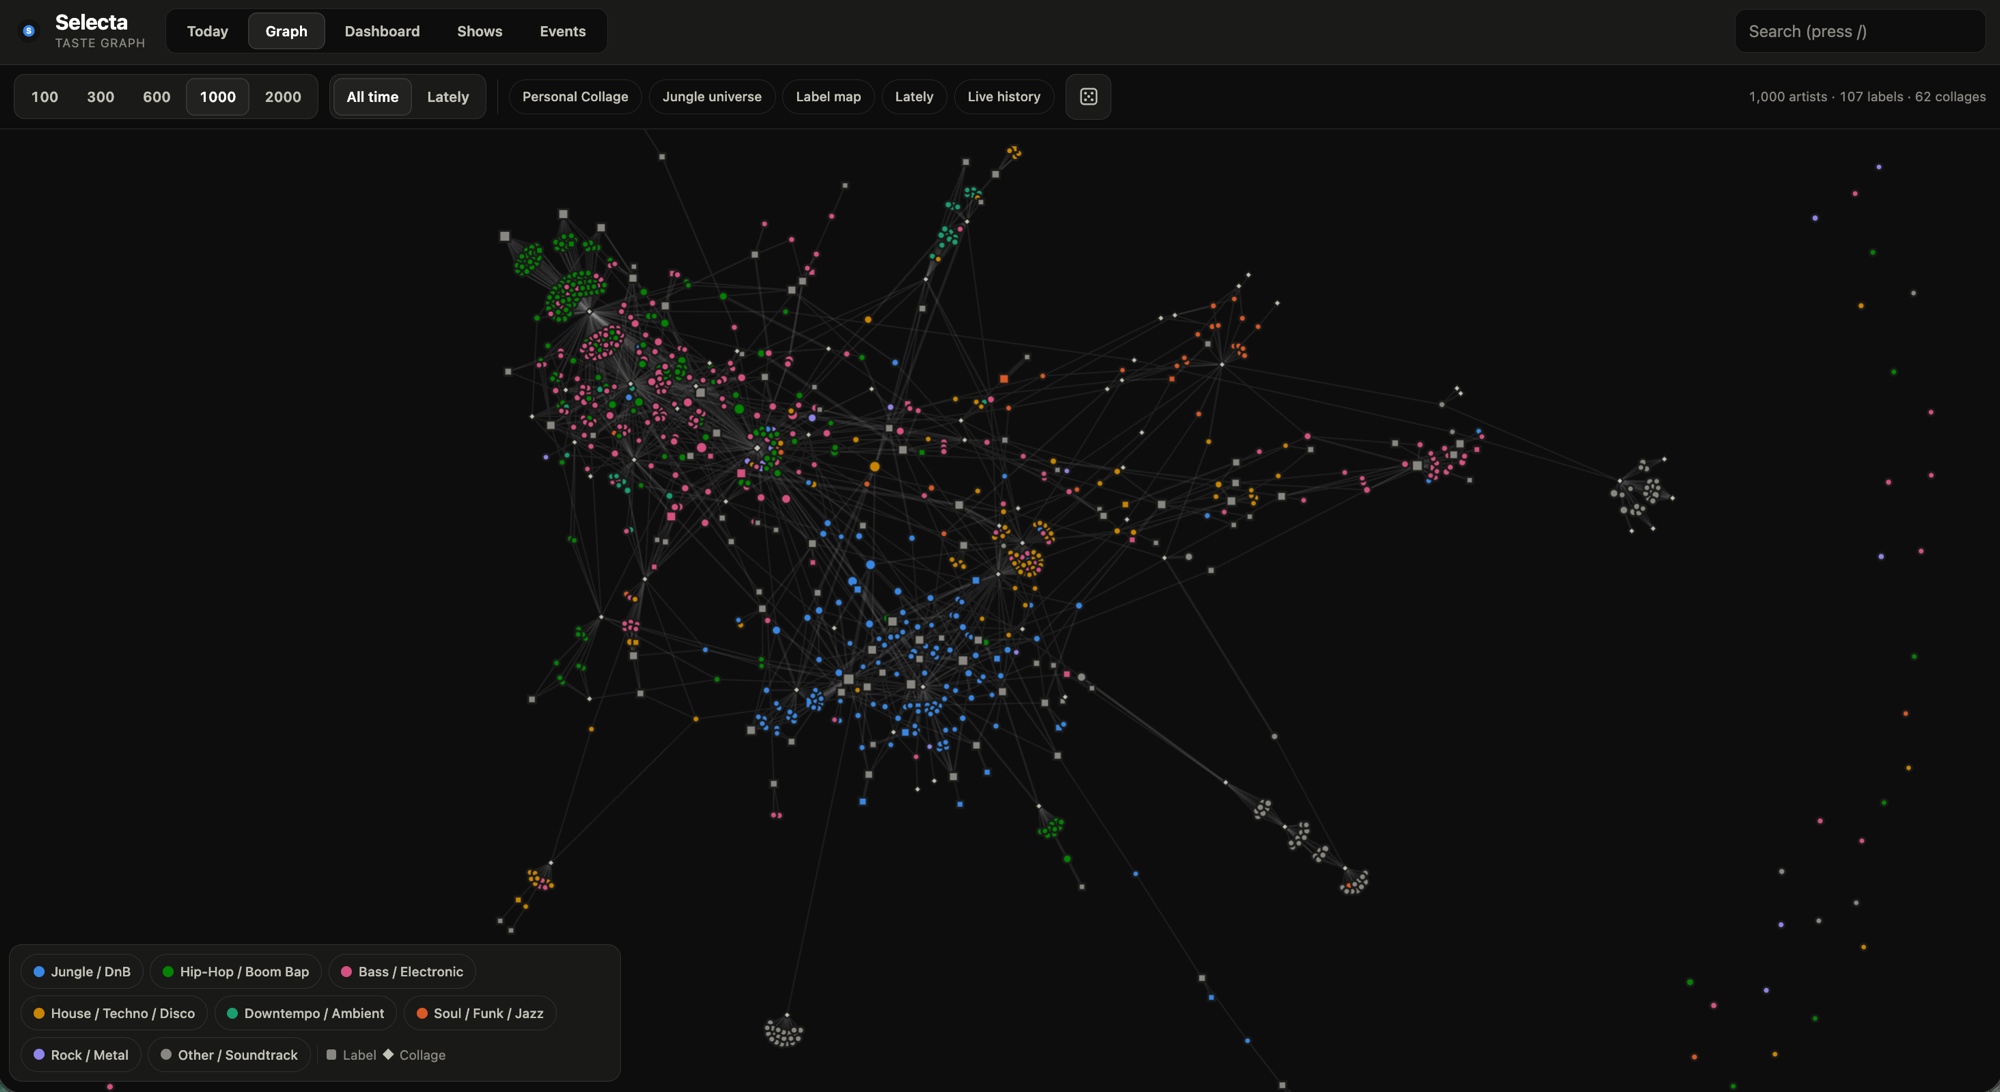
A list of top artists is a leaderboard, and a leaderboard tells you almost nothing. Taste is relational. The interesting fact is never that I have played an artist 400 times, it is that the artist sits on a label whose entire roster I own, three of whose artists I have seen live, filed in a collection I built for a specific mood. Those relationships are edges, so the honest data structure is a graph.
Every artist, label, and collection is a node. An artist links to a label when I own records they released on it, and to a collection when albums of theirs live in it, with the edge weighted by how many. Nothing about the layout is authored: it is a force-directed simulation where linked nodes attract and everything else repels, so clusters are emergent. A genre I have gone deep on pulls itself into a dense knot, a label I follow religiously becomes a visible hub, and one-off albums drift out to the edge where they belong. The picture below is 1,000 artists across 107 labels and 62 collections, colored by genre family and sized by affinity.
Getting around it
Lenses are one-tap presets over the same data: the personal collection, a single genre universe, the label map, what I have been playing lately, artists I have seen live. Depth is a slider from 100 artists to 2,000, because the shape of a taste reads differently at each zoom level. Search jumps to any node, and clicking one opens the artist behind it with the full affinity breakdown, discography, and every show of theirs I have been to.
There is a dashboard behind it for the distributions — genres, decades, countries, labels, plays over time — and a deep-cuts list of high-affinity artists I have not played in a year. Anything with a play button plays through the house. The graph asks J.A.R.V.I.S., J.A.R.V.I.S. talks to the speakers.
Shows
Concert listings are scanned per city from several providers, then every billed artist is matched against the graph, so a lineup comes back ranked by what I actually like rather than by who bought promotion.
When something above a threshold appears, it pushes a notification. Cities are defined in small region files, so tracking a new one is a few lines of config, and any configured city can be scanned live on demand. That last part is really a travel feature: land somewhere, ask what's on tonight, get the listings sorted by my own taste instead of a local top ten.
Festival lineups
This is where the whole thing started. I was looking at a festival lineup, a hundred and some names across five stages. I know my own library, so I know which of those names are in it. The question I could not answer was the other direction: of everything on that poster I have never heard, which ones would I love, given what is in my collection and what I actually listen to. I wanted my own taste used as the reference frame for discovery, and nothing could do that, because nothing could read my collection. selecta got built to answer it, and everything else grew out of it.
selecta serves a REST surface and J.A.R.V.I.S. wraps it as tools an AI can call, so Claude can query it directly: the profile, the top artists, upcoming events, and a lineup matcher. I can drop in a few screenshots of a festival schedule, the cramped grid ones off the official app, and Claude reads the artists off them and hands the list to selecta.
Every name gets looked up against the scored library and comes back sorted into tiers, must see through worth seeing through merely known, each one carrying its affinity, genres, labels, albums owned, play count, and how many times I have seen them. That is the annotated schedule: my single most played, a deep cut I own three records from and have not touched in two years, an act on a label I follow, someone I have already seen four times. A festival app cannot do that, because it does not know me. Picking a stage stopped being a coin flip.
The best part is the pile selecta cannot match. Those are the acts outside my library, and Claude now has an exact picture of what is inside it, down to which labels and scenes and genres carry weight. So it reasons outward from there: this unknown act releases on a label whose roster I already own, this one runs in the same circle as an artist I have seen four times. Discovery anchored to my own collection instead of somebody's engagement model, and the reason I built any of it.
Design choices
Two constraints shaped the whole thing.
- —Read-only, always. The library is the source of truth and selecta is a lens on it. It never writes to the library, the media server, or the wiki, so the worst outcome of a bug is a wrong number in a graph.
- —Degrade, never cascade. A provider that's down is skipped, a live widget that fails renders empty, and a sync that hits a blip retries instead of dying. Every source is something I don't control.
- —The whole graph is one SQLite file. A few hundred thousand plays and a few thousand albums is not big data, and pretending otherwise would have cost me a week of infrastructure I didn't need.
- —The front end is vanilla JavaScript with no build step, which keeps a personal tool from rotting behind a toolchain I have to maintain to change a color.
Where it goes
The backlog is mostly about feeding it better data. Decades of pre-streaming play counts still sit in an old library file. Only a fraction of the shows I've been to are logged, and the ticket receipts to reconstruct the rest are sitting in my inbox.
After that it's discovery: watching the labels I follow for new releases, and letting the graph explain a recommendation instead of just making one.
It is private for now, because right now it is shaped entirely around me and my setup. If this is interesting to you and you want a version that is not, tell me and I will move abstracting it up the list.